• HOME
  • ABOUT
  • ONLINE COURSE
  • MERCHANDISE
MENU

Cardiac Emergencies

The Cardiac Emergencies section includes the following topics


1.

Advanced Life Support Cardiology

ST Elevation mimic?  early repolarization pattern. 


Tachycardia:  Narrow coplex-  Adenosine/Adencard:  3 primary adinistration methods?  1. Push/flush. 2. Stopcock 3.  20 ml mix


 Electrode Placement:   

 fffffffffffffff

Placement confirmation:   R Wave Progression.   V1 through V6

 ffffffffffffff


Rhythm interpretation

Patient context: 

Regular or irregular: 

Heart Rate:

P waves:

PR interval:

QRS Segment:


Twelve Lead interpretation

Patient context:  


QT interval importance:   Widening causes zofran caution? 


Scarbosa-The original three criteria used to diagnose infarction in patients with LBBB are: Concordant ST elevation > 1mm in leads with a positive QRS complex (score 5) Concordant ST depression > 1 mm in V1-V3 (score 3) Excessively discordant ST elevation > 5 mm in leads with a -ve QRS complex (score 2)


T wave changes:  Biphasic


STEMI Equivlents/mimics??

W wellen's syndrome-- recent angina, pain free at presentatioon  biphasic or deeply inverted T waves in precordial

A aVR STE---ST Segent Elevation  V1. Diffuse ST Seg depression  typically inferior or lateral

L left BBB---  Unstable or sgarbossa positi e or smith modified sgarbossa positive

D De Winters---  Upsloping st seg depression greatter than 1mm in precordial leads--

O Out of Hospital ROSC--Use algorithm

S Subtle inferior or lateral---inferior: elevation >/= 0.5 mm in  the two inferior leads  w/std in avl.  lateral: any degree ste in avl w/ std in lead 3.


Field-friendly rule of thumb for LBBB/paced rhythm: count number large blocks S-wave depth (and round up). That's max number mm ST-elevation we should allow in that lead, measured at J-point. So for aVF it's 4 mm, for V3 it's 5 mm.  discordance??


H Hyperacute T waves--large wide T-waves disproportional to QRS

I Isolated P posterior---Precordial depression ofent >/= 2mm v1 and v2 st-seg elevation in posterior leads.


Electrical Therapy


Pacing

Transcutaneous pacing (TCP) is perhaps the most underutilized and misunderstood intervention in all of ACLS. Why? Simple. Because it’s impossible to simulate during training.


Be honest. In paramedic school, when you went through the bradycardia station, and you were given a scenario with a patient who was experiencing hemodynamically unstable bradycardia, what happened when you told the instructor that you wanted to immediately attempt transcutaneous pacing?


If you’re like hundreds of other paramedic students all over the country (and for all I know, the world) you were told: “the pacer is broken.” That was your cue to say, “Okay, then I’d give 0.5 mg atropine rapid IV push.”


Is it any wonder that so many paramedics (and to be fair, other health care providers) perform this skill poorly or not at all?


Let’s look at a case study.


This was an elderly male that the treating paramedic found supine on the floor with an altered level of consciousness. Radial pulses were present, but slow and irregular. The cardiac monitor was attached and the following ECG was obtained.


I don’t remember any other details about the history or clinical presentation, but it’s irrelevant to the central point of this case study.


The treating paramedic elected to perform immediate transcutaneous pacing (TCP). The combi-pads were attached and the pacer was turned on.


As you can see in the ECG strip below, the computer began tracking QRS complexes and the pacer was set for 60 PPM.


I would also like to point out that this particular LP12’s pacer had a default setting of “non-demand mode”. This is somewhat unusual, but it turns out to be the key to solving this case.


The treating paramedic increased the current to 40 mA.


60 mA.


90 mA.


At this point, the paramedic reported radial pulses that corresponded to the pacer and an improved level of consciousness. The rate was changed from 60 to 70 PPM.


Does the paramedic have capture? Be honest! It looks like it, right?


Unfortunately, no. The paramedic does not have capture.


Then what in the Wide World of Sports are the QRS complexes after the pacer spikes?


The answer is that the monitor is showing phantom QRS complexes or false capture.


Don’t believe it? Let me prove it to you.


Here is the same rhythm strip. The underlying rhythm appears to be junctional at approximately 40 beats/min.


In the next strip, you can see the underlying rhythm marching through the absolute refractory period of a (presumed to be) paced QRS complex. That’s not scientifically possible!


In the next strip, you can see a (presumed to be) paced QRS complex in the absolute refractory period of a QRS complex from the underlying rhythm. That’s also impossible!


Finally, you will note that the SpO2 monitor is counting the pulse rate at 42 BPM, not 70 BPM.


Whatever these complexes are that follow the pacer spikes, they do not represent ventricular depolarization.


So what are they?


Artifact.


What kind of artifact?


Electrical artifact.


Let’s look at a side-by-side comparison of the phantom QRS complexes as the current was dialed up.


As you can see, the QRS complexes look essentially the same (QS complexes with an almost vertical downstroke and slightly curved upstroke back to the isoelectric line, non-distinct ST segment, and a virtually absent T-wave). The only difference is the size. As the current was dialed up, the complexes got larger.


As you can see in the following graph, there’s an almost linear relationship between the amount of current and the amplitude (or depth) of the phantom QRS complexes.


Where does this electrical artifact come from? Why didn’t anyone tell us it would be there?


Electrolye disturbances


I was talking to a group of my junior registrars the other day about cardiac physiology, and I was struck by how much trouble they seemed to have relating electrolytes to the QRS complex. We sat down and nutted it all out which left everyone happy. The key to understanding the effects of electrolytes is to understand the cardiac action potential, and how it relates to the QRST complex seen on an ECG. Below is a brief summary of our conversation.

Think for a moment about the basic physiology of the cardiac action potential.
I want you to forget for a moment about all those messy classifications of phase 0 through to phase IV, and don’t for a moment let the Nernst Equation enter your mind.

Just remember that the charge of a cellular membrane depends on 4 ions:
1)    Sodium (Na+)
2)    Calcium (Ca++)
3)    Potassium (K+)
4)    Chloride (Cl–)

Chloride doesn’t play much of a role in the cardiac potential so you can forget about it. (“Thank goodness!” I hear you sigh). Remember that Sodium and Calciumpredominantly exist in the extracellular space, so when the membrane of a cell becomes permeable to their passage they rush into the cell and give it a large +ve electrical charge. Potassium has the opposite effect.

Got that straight in your head? Good.

The Action Potential in Action

Phase 0
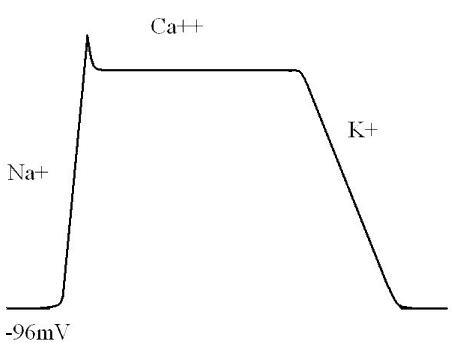
Normally, cardiac myocytes sit with a resting membrane potential of somewhere between -85mV and -95mV.
When the cells become excited sodium channels open. There is a massive influx of sodium (remembering it’s a cation) into the cells and a resulting large positive shift in the resting membrane potential.

This creates a large positive electrical vector. Such a shift shows up as a large deflection on any device designed to measure electrical current, such as an ampere-meter or an ECG recorder.

Phase 2.
I’ve skipped “phase 1” of the action potential, because it’s got a lot of technical details that aren’t really relevant to what we’re talking about.

Once the sodium channels have finished working their magic, calcium channels take up the cudgel and open up. This means that the large positive charge of the cardiac membrane is essentially maintained at level. This manifests as a flat line, or plateau phase. Because there is no major change in the charge of the membrane, there is nothing for our device to measure, and this phase will manifest as a straight line.

Phase 3.
Eventually, calcium influx slows, and potassium channels open, repolarising the heart. This lowers the membrane potential back to its resting levels, and manifests as a large electrical change that can be measured on a current recorder.

The ECG is the sum of millions of myocytes.
Once you’ve got your head around that concept, understanding the ECG in relation to the action potential is relatively easy.

When the cardiac myocytes contract, millions together at once, there is a large change in the electrical field of the heart. Of course, they don’t all contract completely simultaneously – it normally takes them about 0.12 of a second…

In other words, the QRS complex is the product of sodium channel opening in cardiac myoctyes.

If you’re still following, you’ll realise that after the sodium channels have finished their business and the calcium channels open, this results in a long period of non-measurable electrical stability, straight after the QRS complex.

That’s right, I’m talking about the ST segment. It’s the “calcium” bit of cardiac conduction.

The final part should be obvious. As we’ve already described, the influx of K+ when the right channels open causes another large electrical spike, manifesting on the ECG as a T wave.

This is why medical students are often told to remember that the T wave is “full of K+“.

So, what does this have to do with electrolytes?
One of the hardest things to do is to remember what the effects of different electrolyte imbalances are on the ECG. But, if you remember the basic physiology of electrolytes, it’s dead simple.

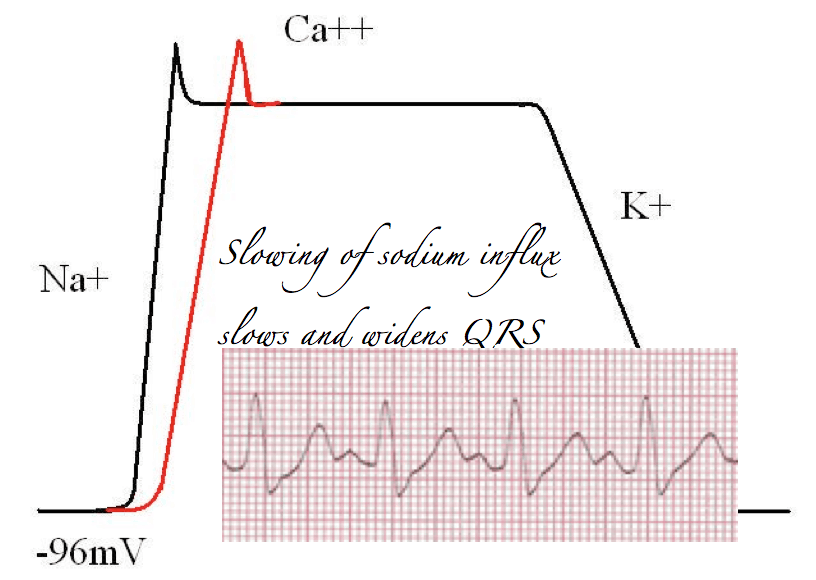
Block sodium channels, and the rate of rise of sodium influx is slowed. This means muscle contractions will take longer and prolong the QRS. Thus, particularly from a toxicology perspective, prolongation of the QRS, should alert the astute reader of an ECG to the presence of sodium channel blockade.

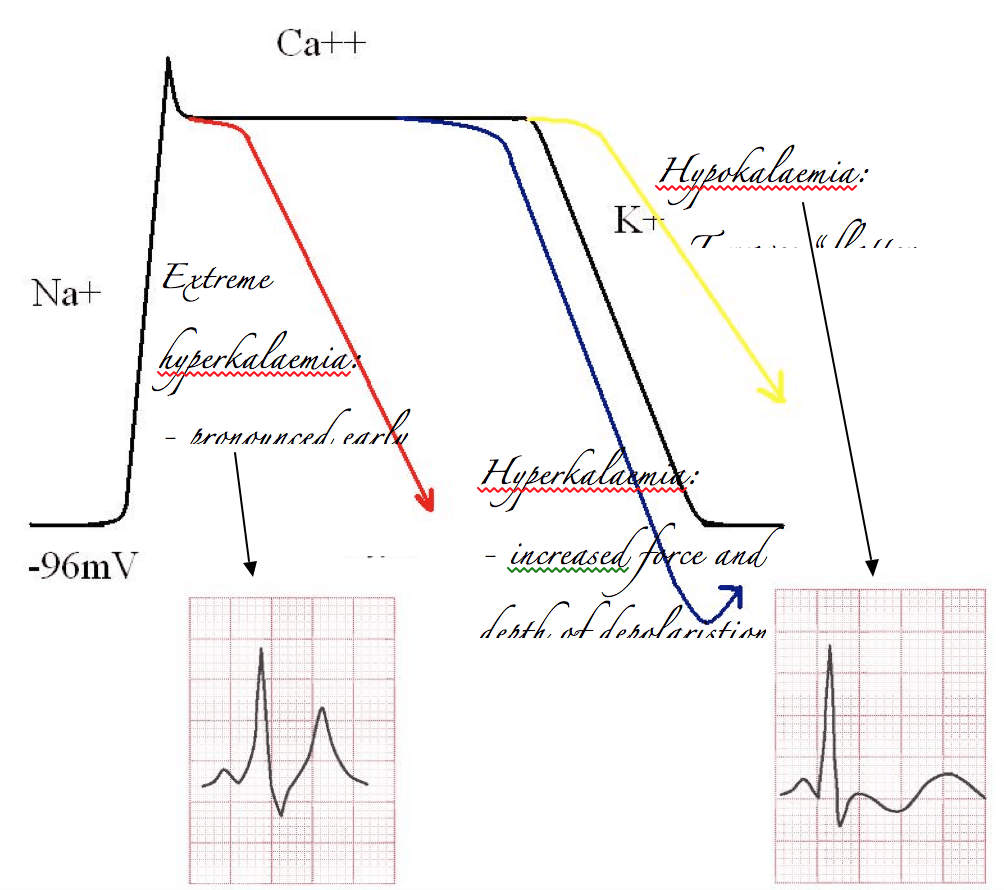
Alternatively, if you’ve got too much potassium on board it’s easy to predict that the influx of potassium will be more impressive than it otherwise would. Therefore the repolarisation curve will be steeper than normal, and overshoot. This will increase the size and volume of the electrical deflection measured on the ECG, which is of course the T wave. In extreme cases this will cause very early repolarisation, and at the same time an increase in basal K+ exchange across the membrane will slow the rate of sodium induced depolarisation. A sinusoidal waveform develops.

The opposite effect occurs with hypokalaemia. Depolarisation is less impressive, and T waves “flatten out”.

What about calcium?
Calcium is a bit trickier. Classically hypercalcaemia is taught to shorten the QT interval. This is not quite what you’d expect from more calcium. You’d be forgiven for thinking that more calcium would prolong the plateau phase and increase the QT interval. (I should point out in the real world that the association between calcium and QT shortening is dubious at best.) But, you need to remember a couple of things:

– Calcium is a positive inotrope, and increased contractility shortens the QT

– Calcium transport affects potassium transport. More calcium causes bigger shifts in potassium, and may cause earlier depolarisation.

 That all seems a bit long winded!
And it is. If you’ve read this far, congratulations! Remember:

Sodium is the primary ion affecting the QRS complex.
Potassium is the primary ion affecting T waves
If there is a QT abnormality, you should check a serum calcium!


Hypocalcemia

Hypocalcemia refers to a total calcium < 8.5mg/dl or a ionized calcium <4.4mg/dL

Total Calcium refers to the Calcium attached to specific proteins within your body, where ionized Calcium is the unattached “free” Calcium available for use.

There are several different causes of hypocalcemia. Using the mnemonic HARVARD may be helpful.

Hypoparathyroidism
Acute Pancreatitis
Renal Failure / Rapid Transfusion (CITRATE)
Vitamin D3 deficiency
Alkalosis
Rhabdomyolysis
Drugs

Heart Rhythm Interpretation

Sinus Rhythm

Sinus Bradycardia

Sinus Tachycardia


Pulmonary Embolisim l

PetCO2PetCO2 is the gold standard to confirm endotracheal intubation and monitor high-quality CPR. PetCO2 reflect the partial pressure of exhaled carbon dioxide and can be measured through both side stream and inline applications.4 In the pathophysiology of a PE, an acute blockage of pulmonary vessels reduces perfusion to alveoli. Alveolar dead space, area of the lung without perfusion, then begins to increase. With this, the elimination of carbon dioxide is reduced, and carbon dioxide-free gas mixes with gas from perfused alveoli resulting in a lower PetCO23,4 Unfortunately, these manifestations of PE often overlap those of other pulmonary disease processes. Therefore, PetCO2 can only be confidently used to support, but not prove, the presence of a massive PE.3 

12-Lead ECG

For patients who present to EMS with chest pain, cardiac dysrhythmia, or difficulty breathing, 12-lead ECG is the primary diagnostic tool for identifying acute myocardial infarction (AMI). Prehospital ECGs can significantly decrease door to balloon times and the AMI mortality rate.5 Certain ECG changes may also occur in the presence of a hemodynamically significant PE. In the case above, the patient presented with a RBBB with tachycardia. It has been observed in patients with RBBB, tachycardia, S1Q3T3 pattern, inverted T waves in V1-V4, and ST Elevation in aVR are prone to a greater opportunity for circulatory collapse and shock.6 Regardless of its sensitivity rate, this supports the importance of prehospital ECG transmission to reduce time to interventions.

Assessment

There are many reasons that a patient can have vital signs that fall outside of normal limits. When those are measured, it is essential to correlate findings on the monitor to a good clinical assessment. One can use assessment pneumonics such as SAMPLE and OPQRST. An excellent clinical assessment can confirm or change the course of clinical care. For example, asking questions about the patient’s past medical history could reveal that the patient had surgery recently and had been sedentary, the likelihood of PE. 

COPYRIGHT MICHAEL TODD MULLENIX. ALL RIGHTS RESERVED
Crafted by Zibster
CLOSE
  • HOME
  • ABOUT
  • ONLINE COURSE
  • MERCHANDISE